On August 23, 2017, Microsoft announced the release of the Power BI solution template for Microsoft Dynamics 365 for Field Service. The template includes a set of reports designed for field service professionals. The solution template offers a very fast guided experience to create compelling reports on an extensible, scalable, and secure architecture and can be customized as needed. This means that instead of spending your time on plumbing, you can instead spend it on extending and customizing the solution template to meet your organization’s needs.
In this post, we will create the same report functionality inside of Power BI using Dynamics GP Field Service’s service call information. We first need to get the information from the following Field Service tables:
- SVC00100 – Technician Master
- SVC00200 – Service Call Master
- SVC00201 – Service Call Analysis Codes
- SVC00203 – Service Call Line Detail
- SVC00901 – Cause Codes Validation
- SVC00906 – Warranty Validation Codes
- SVC00907 – Problem Codes Validation
- SVC00908 – Repair Codes Validation
- SY03900 – Record Notes Master
Almost all the tables are a straight import of the data except for the Service Call Analysis Code. This table contains Equipment Item Number, Problem Code, Repair Code and three note indexes with the Service Techs’ notes related to the fix. For this data, I created the following view:
ALTER View [dbo].[ServiceCallEquipment]
AS
SELECT [SRVRECTYPE]
,[CALLNBR]
,[LNITMSEQ]
,[EQUIPID]
,[ITEMNMBR]
,[PRDLINE]
,[PROBCDE]
,[CAUSECDE]
,[RPRCODE]
,coalesce(a.TXTFIELD, ”) as [Note_1]
,coalesce(b.TXTFIELD, ”) as [Note_2]
,coalesce(c.TXTFIELD, ”) as [Note_3]
FROM [dbo].[SVC00201]
LEFT OUTER JOIN dbo.SY03900 a on SVC00201.Note_Index_1 = a.NOTEINDX
LEFT OUTER JOIN dbo.SY03900 b on SVC00201.Note_Index_2 = b.NOTEINDX
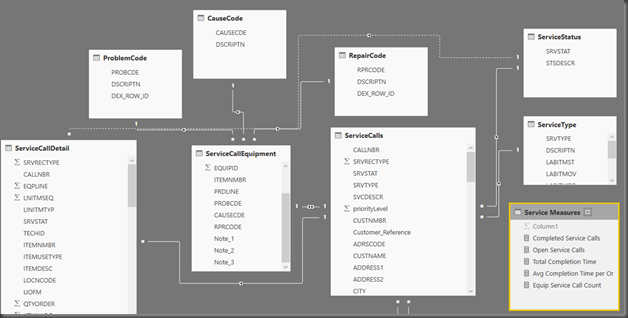
Now that we have determined our Service Call data points and imported the data into Power BI, we need to create our table relationships. The final table relationship model should look like this:
With our relationships established, we now need to create our measures to be used in our reports. Here are the DAX measures I’ll be creating:
- Completed Service Calls
Completed Service Calls = CALCULATE(COUNTROWS(ServiceCalls),FILTER(ServiceCalls,ServiceCalls[SRVSTAT]=”70C”))
- Open Service Calls
Open Service Calls = CALCULATE(COUNTROWS(ServiceCalls),FILTER(ServiceCalls,ServiceCalls[SRVSTAT]<>”70C”),ServiceCalls[SRVSTAT]<>”OOC”)
- Total Completion Time (in Minutes)
Total Completion Time = SUMX(FILTER(ServiceCalls, ServiceCalls[SRVSTAT]=”70C”),[Completion Time])
- Avg Completion Time per Order (in Minutes)
Avg Completion Time per Order = DIVIDE( [Total Completion Time],[Completed Service Calls],0)
- Equip Service Call Count
Equip Service Call Count = COUNTROWS(ServiceCallEquipment)
Analyzing Open Service Calls
Now it’s time to create our reports. The first report we are going to create is for our Service Calls or Open Work Orders. For this report, we will use the following charts:
- Active Work Order – Using a Card visual and Open Service Calls measure.
- Work Orders by Type – Using a Donut Chart and Open Service Calls measure and Service Type.
- Work Orders by Status – Using a Donut Chart and Open Service Calls measure and Service Status.
- Open Work Orders by Resource – Using a Stacked Bar Chart and Open Service Calls measure in the Values section and Service Tech and Customer Name in the Axis section of the chart.
- The final visual on the report is a matrix to see our open work order details associated with each chart above when click on them to cross filter.
Here is what the Open Work Orders report looks like:
Analyzing Completed Work Orders
Time to analyze our completed service call/work orders. For this report, we will use the following charts:
- Completed Work Order – Using a Card visual and Completed Service Calls measure.
- Avg Completion Time (in Mins) – Using a Card visual and Completed Service Calls measure.
- Avg Completion Time per Order by Service Type – Using a Stacked Column Chart and Completed Service Calls measure and Service Type.
- Avg Completion Time per Order by Service Tech – Using a Stacked Column Chart and Completed Service Calls measure and Service Tech ID.
- The final visual on the report is a matrix to see our open work order details associated with each chart above when click on them to cross filter.
Here is what the Completed Work Orders report looks like:
Analyzing Equipment Repairs
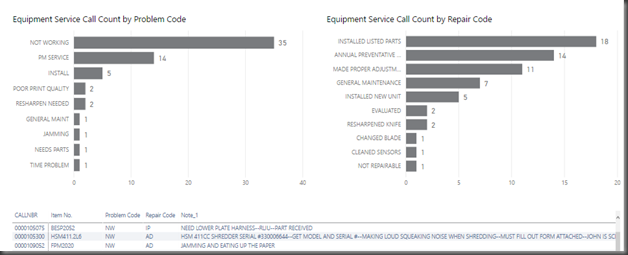
Time to analyze our completed service call/work orders. For this report, we will use the following charts:
- Equipment Service Call count by Problem Code – Using a Stacked Bar Chart and Equip Service Call Count measure in the values section and Problem Code and Customer Name Axis section.
- Equipment Service Call count by Repair Code – Using a Stacked Bar Chart and Equip Service Call Count measure in the values section and Repair Code and Customer Name Axis section.
- The final visual on the report is a matrix to see our open work order details associated with each chart above when click on them to cross filter.
Here is what the Completed Work Orders report looks like:
Conclusion
Stay tuned for the future Power BI developments and an overview of their functionality and for help with building reports like this.


